Archive | Tools RSS feed for this section

Alert! Overstuffed Stocking

17 Dec

HolidayTwinkles

I have a folder on my favorites bar called, “Weekly Blog Post Items” into which I toss bookmarks for sites that I find interesting, helpful, or just fun – things that I think readers of my blog might enjoy, too. As I tossed yet one more URL in it this morning, I realized that it was overflowing. Ah, but ’tis the season for giving and so I give to you, my readers, the gift of a whole bunch of stuff to peruse. Let’s unpack the stocking, shall we?


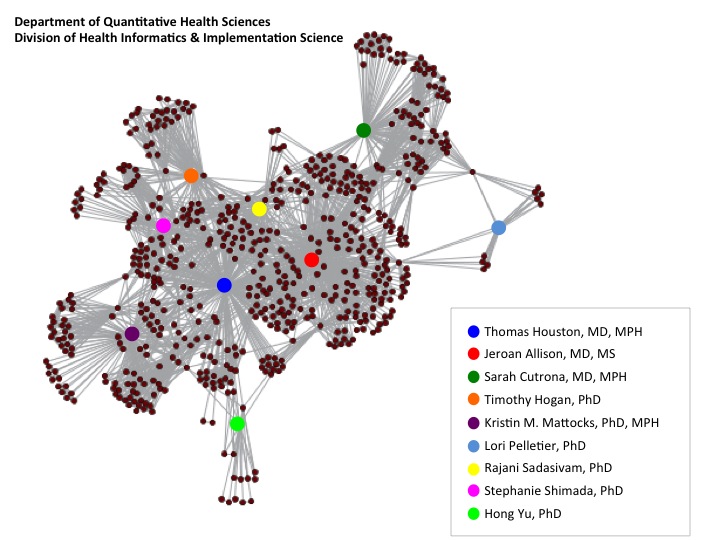
 14 Data Visualization Tools to Tell Better Stories with Numbers is a really nice article by marketing executive, Rob Peterson, posted on the website {grow}. Mapping, timelines, infographics and more are covered, along with links to popular tools to create each. One that I particularly liked is Timeline JS3. I’ve played with it a little bit and it’s pretty cool.

I may have mentioned Print Friendly before, but I love it so much, it’s certainly worth shouting out again. You can either use the website or download the browser button to quickly and easily print only what you want from a website. Don’t want to waste space and ink on that picture? ZAP! It’s gone. Tired of obnoxious ads on your printouts? POW! They’re gone. It’s awesome!

Narrative Visualization: Telling Stories with Data is a very informative and interesting journal article by Edward Segel and Jeffrey Heer of Stanford. It gives insight into balancing visualizations within and/or alongside the narrative.

Every now and then, I go on a hunt to find a presentation platform other than PowerPoint. I admit that while I’ve tried others, I ultimately return to the ruler of the class, but it doesn’t keep me from looking. Beyond PowerPoint: 11 Other Presentation Tools for Small Businesses is a nice collection. Some are likely very familiar to you (Prezi, Haiku Deck, Keynote), but I didn’t know about Projeqt, VideoSlide, or Zentation before I came across this article.

Have you heard of the Relative Citation Ratio (RCR) yet? I hadn’t before reading this article from the American Society of Cell Biology. Those who work in scholarly communications and/or in areas involving tracking and measuring research impact will find it particularly interesting.

LifeCharge describes itself as a “simple elegant journal of your ups and downs.” It’s an app to help you track the things that make you happy, as well as those that bring you down, the goal being that as you look back on the data and the patterns shown, you can make positive changes in your life that might lead you to a happier place. It’s on my “give it a try” list.

Another app on that same list is The Brainstormer. A pocket spinning wheel of nouns, adjectives, and adverbs, that, once the spinning stops, line up to reveal a creative prompt. Here’s one I got… Pursuit > Disco > File Room. Now who couldn’t make a great story, poem, song, drawing, or the like out of that? Ready, Set, GO!

STAT is a new news site, focused on stories at the intersection of science, health, medicine, politics, and money. It’s got big backers from all of these fields behind it, so it may make it in the crowded world of competitors. So far, I’ve found it a very good place to find in-depth reporting on timely, relevant subjects.

This is what the inside of a British cat pub looks like. From Mashable. Need I say anything else?

Back in November, there was a FANTASTIC Google Doodle for Hedy Lamarr. What an amazing woman. Yes, she was a Hollywood star, but did you also know that she’s been inducted into the Inventor’s Hall of Fame? As I said… amazing. Here’s a story about her from the Washington Post.

As it’s that time of year, Slate Magazine published a good list of Best Movies of 2015; Paste Magazine’s 50 Best Songs and 50 Best Albums of the year have a number of nice picks; and you can find a list of all of Mark Zuckerberg’s “Year of Books” choices here. I hope to compile a few of my own “Best Of” lists in the next week or two. When done, I’ll of course share them here.

I discovered ZeeMaps thanks to a tweet by Melissa Rethlefsen. After I posted my “See the World as a Medical Librarian” map a few weeks back, she made her own map using this tool. I immediately bookmarked it.

Less for content than for the step-by-step guide to using Facebook’s Audience Insight tool for seeing trends, themes, etc. among Facebook users, I enjoyed Rob Leathern’s post on Medium entitled, Who is the Average Donald Trump Supporter?

And finally, because celebrating Christmas means, to me, repeating a number of time-worn rituals (I still get up at 5 AM on Christmas morning and run to the tree to see what Santa brought), I share Amy Dickinson’s story of Peanut Jesus, as she titles it, “My modern nativity story: Making Peanut Jesus.” I read it every holiday season. It’s hilarious and touching. I just love it.

P.S. I also read the chapter about the Christmas Pageant from John Irving’s, “A Prayer for Owen Meany.” Owen as Baby Jesus rising up out of that crib in the manger… I laugh until I cry.

Happy Holidays to you all! Thank you for following along with me another year.

The Art of Collaboration

12 Nov

[The following is my monthly column for the November issue of the UMCCTS newsletter.]

One of the goals of the UMCCTS is to promote and facilitate collaboration across departments and disciplines, thus effectively reducing barriers between the basic and clinical sciences, and ultimately speeding the pathway between the discovery and implementation of new treatments, therapies, and the like that improve health. One means of demonstrating collaboration is through co-authorship. The networks that develop between authors of publications give us a picture of how individuals are connected and where collaborations exist.

Social network analysis is the process of investigating social structures through the use of network and graph theories. It characterizes networked structures in terms of nodes (individual actors, people, or things within the network) and the ties or edges (relationships or interactions) that connect them. (Wikipedia, Social Network Analysis

For this month’s column, let’s look at an example of a social network analysis that shows the co-authorship relationships between members of the Division of Health Informatics and Implementation Science in the Department of Quantitative Health Sciences (QHS). QHS is one of the newest departments at UMMS, with several of the senior faculty arriving on campus only about 6 years ago. The research that the Department does in developing innovative methodologies, epidemiological research, outcomes measurement science, and biostatics is integral to the nature of clinical translational research. By examining the co-authorship relationships of members of the Health Informatics group, we get a snapshot of how well these faculty members are connecting with other departments, other disciplines, and even other institutions. In short, we see how and where collaborations have developed and thus how well the UMCCTS goal of building them is being met.

To do this analysis, we first need to identify all of the publications authored by at least one of the Division’s faculty members for the period of time that s/he has been part of the Division, as well as all of the unique co-authors associated with these papers. In doing this, I found 221 publications authored by 716 different individuals. Using Sci2, a toolset developed at Indiana University, I was able to analyze the patterns and create a visualization showing the connections between the co-authors.

Informatics Division CoAuthor Network

One thing that we clearly see is that several faculty members are prominent hubs in the network, meaning they co-author many papers with many people. Drs. Houston and Allison are the most obvious examples here. We can also see that a number of branches grow from the periphery. At the base of each of these is a faculty member from the Division (counterclockwise from upper right, Drs. Cutrona, Hogan, Shimada, Mattocks, and Yu). Finally, we note that even hubs that are less connected to the clustered middle, e.g. Drs. Yu and Pelletier, are still linked, representing the reach of the collaborative network that the Division has formed over the past years.

Tools like Sci2, Scopus, SciVal, and ISI Web of Science provide another way, i.e. a visual demonstration, of the success of our programs and the impact of the translational science being done by the members of the UMCCTS.

Sci2 Team. (2009). Science of Science (Sci2) Tool. Indiana University and SciTech Strategies, https://sci2.cns.iu.edu.

Share and Share Alike

1 Oct

One of my favorite books from the past few years is Austin Kleon’s, Steal Like an ArtistI’ve mentioned it in several previous posts (search “Austin Kleon” on the site and you’ll find them), mostly because I continue to pop back to it on a regular basis. It’s filled with plain, simple, good thoughts to inspire your creative side. I also follow Austin on Twitter. Awhile back, he declared that he was going to shift from immediately tweeting out lots of ideas, project updates, and interesting things he came across online to putting them all in an indexed version that he’d send out via his Tumblr account on Fridays. Of course, as soon as I saw this announcement I signed up for his email list and ever since, his Friday email to me has become something that I look forward to.

My new role as an evaluator finds me doing a lot of things that I’m hard pressed to chronicle as I once did for my work in the library world. In part, I think it’s because I spend a great deal of time learning new things and/or putting newly learned skills into action. It takes time and energy that ultimately takes away from my abilities to come up with interesting musings for this blog. That said, I’m not about to give up my blogging habit. It means too much to me. After lots of thinking about how to revitalize it, the thought came to me to take Austin’s advice and steal an idea … from him!

Thus, I’ve decided to shift the pattern of own blog a bit – at least for awhile – and turn it into a way to share with you, my readers and followers, some of the cool and interesting and inspiring and, dare I hope, helpful things that I come across weekly in my work and play. So here we go … here are a few things from the past several weeks (I’m cheating already, but it’s the start of a new thing and thus allowed). Enjoy!

  1. It only seems fair that I give a tip of the hat to Mr. Kleon to start. Besides his books, I also enjoyed watching the video from a terrific talk that he gave to an audience at Google a few years ago. It’s a wonderful summary of his theory on stealing and some inspiring words to anyone seeking to get out of the way of themselves when it comes to creativity.
  2. Juice Analytics is a data analysis and design firm in Atlanta that provides visualization services to businesses and organizations. They also freely offer a number of great resources for learning these skills, including white papers, video tutorials, and the book, Data Fluency (not free, but well worth the $21.59 price tag for my Kindle version). One of the best resources on their freebie page is “30 Days to Data Storytelling,” a guide to … well, it’s pretty self-explanatory, isn’t it? It’s a list of videos, tutorials, articles, etc., a few a day for 30 days, to help you understand how to use data to tell your story. Good stuff.
  3. Back at the end of the summer, just as school was ready to gear up, Slate published a series of blog posts during one week under the banner, What Classes Should I Take? The list is fascinating and the posts very well written. Two that I liked in particular were, The Secret Technique for Learning How to Code: Step 1. Don’t Be Intimidated, by Victoria Fine, and What are the Odds: To Learn to Think Critically, Take a Statistics Class, by Laura Miller. These two are most relevant to anyone in the library, information, or evaluation worlds. I also found the advice to take Art History, Public Speaking, and No Class at All, quite valuable. The entire series was great.
  4. The Noun Project – Icons for Everything – is pure awesomeness. A gazillion free icons to drop and drag and plop into place OR inspire you to make your own.
  5. One thing that I do often in my job is doodle pictures to tell the story of a particular group of researchers or a research center. Fancy word, infographics. Since I started sharing some of these on this blog and other places, several colleagues and friends have asked for advice on tools to use to make them. I tend to draw my own in Illustrator and/or Powerpoint, but there’s a handy list of 10 Free Tools for Creating Infographics on the Creative Blog website.

Finally, I think I’d like to add one consistent thing for each of these lists/posts. I’m going to call it, What’s On My Desk Right Now. Right now, it’s this:

Visual Storytelling

Visual Storytelling: Inspiring a New Visual Language, edited by Klanten, Ehmann, & Schulze, and available through Gestalten. I learned about this book after stumbling upon an interview with Jonathan Corum, the graphics editor for science at the New York Times. He’s one of many featured in this book and I can’t wait to dive into it. Now. Lunchtime reading!