[The following is my monthly column for the November issue of the UMCCTS newsletter.]
One of the goals of the UMCCTS is to promote and facilitate collaboration across departments and disciplines, thus effectively reducing barriers between the basic and clinical sciences, and ultimately speeding the pathway between the discovery and implementation of new treatments, therapies, and the like that improve health. One means of demonstrating collaboration is through co-authorship. The networks that develop between authors of publications give us a picture of how individuals are connected and where collaborations exist.
Social network analysis is the process of investigating social structures through the use of network and graph theories. It characterizes networked structures in terms of nodes (individual actors, people, or things within the network) and the ties or edges (relationships or interactions) that connect them. (Wikipedia, Social Network Analysis)
For this month’s column, let’s look at an example of a social network analysis that shows the co-authorship relationships between members of the Division of Health Informatics and Implementation Science in the Department of Quantitative Health Sciences (QHS). QHS is one of the newest departments at UMMS, with several of the senior faculty arriving on campus only about 6 years ago. The research that the Department does in developing innovative methodologies, epidemiological research, outcomes measurement science, and biostatics is integral to the nature of clinical translational research. By examining the co-authorship relationships of members of the Health Informatics group, we get a snapshot of how well these faculty members are connecting with other departments, other disciplines, and even other institutions. In short, we see how and where collaborations have developed and thus how well the UMCCTS goal of building them is being met.
To do this analysis, we first need to identify all of the publications authored by at least one of the Division’s faculty members for the period of time that s/he has been part of the Division, as well as all of the unique co-authors associated with these papers. In doing this, I found 221 publications authored by 716 different individuals. Using Sci2, a toolset developed at Indiana University, I was able to analyze the patterns and create a visualization showing the connections between the co-authors.
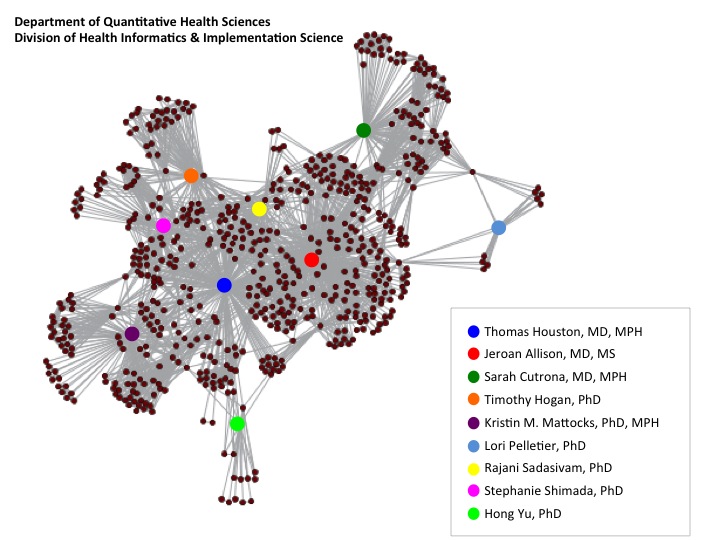
One thing that we clearly see is that several faculty members are prominent hubs in the network, meaning they co-author many papers with many people. Drs. Houston and Allison are the most obvious examples here. We can also see that a number of branches grow from the periphery. At the base of each of these is a faculty member from the Division (counterclockwise from upper right, Drs. Cutrona, Hogan, Shimada, Mattocks, and Yu). Finally, we note that even hubs that are less connected to the clustered middle, e.g. Drs. Yu and Pelletier, are still linked, representing the reach of the collaborative network that the Division has formed over the past years.
Tools like Sci2, Scopus, SciVal, and ISI Web of Science provide another way, i.e. a visual demonstration, of the success of our programs and the impact of the translational science being done by the members of the UMCCTS.
Sci2 Team. (2009). Science of Science (Sci2) Tool. Indiana University and SciTech Strategies, https://sci2.cns.iu.edu.


