Tag Archives: visual literacy

Thinking with Pictures

8 Sep

I wrote the other day that I drew a picture to help me figure out the methodology of the study and where the different sources of data fit in. Drawing pictures helps me a lot. And I’m not alone. In fact, if you do the slightest bit of reading into the literature on how we think and perceive and remember, you’ll quickly find that our brains are arranged to take in information visually almost 3 times more than our other 4 senses combined. We are visual thinkers. Sadly, though, we live in a society based much more on verbal and written communication. That might explain why we’re so confused, but I’ll resist the urge to digress onto that thought.

I’m fascinated with the topics of visual communication and visual literacy and visual note taking. I’m also really lucky to be married to someone who teaches in this field (as a subset of graphic design) and so I’m privy to a lot of great books and journals and magazines. Between Lynn’s teaching and my interest, we’ve developed quite the library.

I’ve also been lucky in that I was recently asked to speak on a panel at the upcoming “Emerging Roles Symposium” being hosted by the Pacific Northwest Chapter of the Medical Library Association. During the panel, I’ll be talking about my role supporting eScience. There are several panels and a whole bunch of great speakers and topics. It’s going to be a terrific program and I couldn’t be more pleased to take part.

The invitation also came with another to teach a continuing education class. If you’re flying all the way across the country for a meeting, you might as well make the most of it. Of course, I said, “Sure!” Note that I said “Sure!” before ever agreeing on what I’d teach. In the back of my mind though, for a long while, had been the thought to develop a class around my interest and knowledge of visual communication, and so I proposed this to the CE Committee. The result –  Bullet Point 1, Bullet Point 2, Bullet Point 3… the Audience Flees: Visual Communication Skills for Effective Teaching and Presentations – a class that, up until I got distracted by writing this blog post, I was working on this morning.

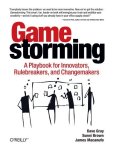
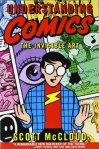
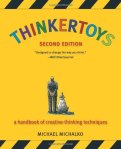
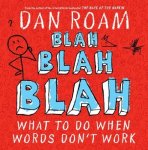
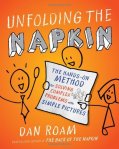
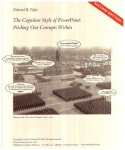
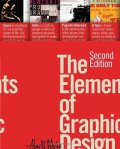
I thought I’d merge my class prep into this post by sharing the bibliography that I’m putting together. These are just some of the books that I’m using, but it’s a great collection to get you started on getting to know this topic. When I think about the skill set needed to be an embedded librarian, I think that two of the most important skills one must have for success are creativity and  problem solving (critical thinking, analytical thought, however you might describe it). Or better put, maybe the one skill needed most by an embedded librarian is creative problem solving and one of the best ways to hone our creative problem solving skills is to practice visual thinking. So without further ado, here’s a small library to get you going (presented visually, of course):

First Day of School

5 Sep

September 4, 2012

This isn’t my first day meeting with the team. We met to collaborate on the grant proposal, of course, and I’ve met with several team members here and there over the past month, but today marked the official beginning of my time on the project. You can probably guess what it started with… as with most anything at work, it started with a meeting. Two of them, in fact.

First, was the monthly meeting where many of the people involved (there are approximately 25 people across 4-5 campuses and/or institutions working on this study!) either attend in person or call in. It’s an update call, a time to document the progress on everything from the number of participants recruited and/or interviewed, to the number of glitches in the various computer programs fixed.

Mostly, it is a time for Process Evaluation. This is an important term, I quickly learn. A large research study is continually evaluated to insure that each step, each part, is producing the data required to ultimately answer the research question. In this case, the National Cancer Institute is giving the researchers a substantial amount of money over several years to investigate what type of intervention works best and is the most cost-effective to insure that women get mammograms, a proven measure in the early discovery and treatment of breast cancer. Without the correct data, the question will go unanswered – or worse, answered incorrectly.

For me, the interesting aspect of the emphasis on process evaluation is that it is the reason the PIs were most excited about adding an informationist to their team. With multiple people and multiple sources of data involved in the study, communication – or better put, troubles with it – are a big concern. My first, and perhaps primary, role on the team is to discover, create and implement the tools necessary to decrease these miscommunications. People are using different terms to describe the same thing. Variables lack clear definitions. We need some controlled vocabulary. Now there’s a good librarian word! And with it, I can see my value pretty quickly.

Meeting #2 involves talking about this role more specifically. My first task is spelled out, “Create for us a Data Dictionary.” Fortunately, I have about 10 months to do this, but by next week, I’m to present my ideas on how I’m going to do this. What am I going to create? What software might I need? What will work best?

I spend the rest of my day thinking about this. I read the grant proposal again. I read a published paper on the study. I sketch out a picture of the methodology, trying to figure out when and where each data source comes into play. It’s no easy task. We have 4-6 (depending on who’s describing it to me) sources of data; 4-6 codebooks; countless variables in total. And of course, they are interconnected in countless ways.

In the end, I determine that I need to make something interactive, something that will allow the users to see not only the definitions of the variables, but also where and how they relate to others. A static document won’t do. I wish I had the programming chops to use ThinkMap (the software behind the Visual Thesaurus), but lacking that, I take time reviewing some other mind mapping and/or visualizing tools. I download a free trial of MindJet and play around with it for awhile. This might work, but I’m not ready to recommend it yet. There are other things out there, I know. I need to look at them, too.

Bottom line: This first day of class was WAY more than a “just hand out the syllabus and leave” day. I think I deserve a new pencil!