I few weeks back, I was invited by the good folks at Altmetric to take part in a webinar to discuss my use of alternative metrics in my work as an evaluator for the UMass Center for Clinical & Translational Science. The webinar is available online, but for those who might want to see my slides and read the transcript from my part, here you go:

 I thought that I’d start with an overview of what’s happening regarding evaluation from the National perspective, since NCATS, the National Center for Advancing Translational Sciences, as the overseer of the CTSA program, steers the ship, so to speak. For those unaware, NCATS is the Center within NIH that oversees the 62 CTSA programs across the country.
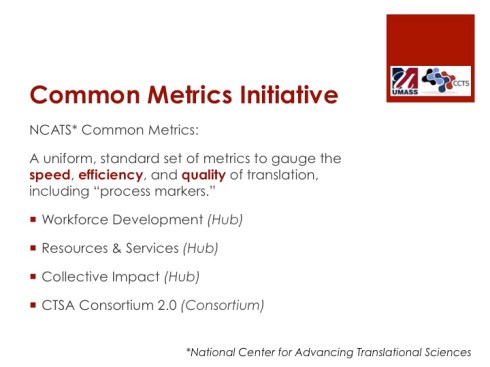
The Common Metrics Initiative is a fairly new – or I should say re-newed/re-tooled – working group coordinated by some of the Principal Investigators from the CTSA sites. FYI, the proper jargon for a site is now, hub. So when you see the word “hub,” it refers to an individual CTSA site, such as the UMass Center for Clinical & Translational Science, where I work. Consortium refers to all of the sites, as a whole.
The Common Metrics Initiative came about in an effort to better measure, evaluate, and disseminate the impact of translational science and the concepts behind it. If you think about it, the idea of translational science is that by eliminating some of the barriers and obstacles that exist between biomedical research, clinical research, and clinical practice, discoveries that improve health will move from the lab bench to the bedside, i.e. patient care, faster. The questions of how we measure the truth of this idea is what’s behind establishing a set of common metrics – a uniform, standard set of metrics that measure the speed, efficiency, and quality of this large practice called translational science.
With multiple centers, an infinite amount of programs and research projects, countless individuals involved as researchers, clinicians, students, subjects… you can easily imagine how difficult it is to come up with a common set of metrics that everyone will collect and analyze. But it’s certainly an important thing to do, not only so that we can evaluate our respective individual hubs, but also so that we can compare across hubs.
Briefly, there are four key areas that have been identified as targets for the implementation of common metrics – workforce development (this involves training opportunities for individuals to learn, among other things, how to conduct clinical research); resources and services of each CTSA site; the collective impact of all the programs, functions, and such of an individual site; and the larger CTSA consortium as a whole.
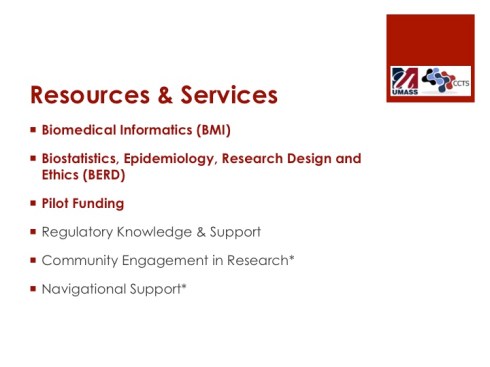
 For today’s talk, I’m going to focus on the area where alternative metrics are most useful. NCATS defines the different resources and services each hub offers as the following:
- Biomedical informatics
- Biostatistics, Epidemiology, Research Design and Ethics (commonly known as “the BERD”)
- Pilot project funding
- Regulatory Knowledge and Support
- Community Engagement in Research
- And Navigational Support – how well those administering hubs connect people to the resources and services that they need.
 Further, I want to focus on the first three bits within this area, BMI, the BERD, and Pilot Funding.
 As the evaluator for the UMCCTS, my job is basically all about answering questions. It’s a good thing that I was a librarian already, since answering questions is the librarians forte. I can also say that one of the things that I love most about being a librarian is answering interesting questions, and my role now certainly offers up a few interesting questions like these:
How effective are our resources and services – from bioinformatics to the parts of the BERD – in contributing to translational research?
When we give people money for pilot research, how well does this research then generate funding for further research? And then, what’s the impact of that research? How is it transforming health care practice and, ultimately, health?
And then the big elephant in the room, not mentioned on this slide, how do we go about answering these questions? The idea of identifying and analyzing a core set of common metrics is one attempt, but what should those metrics be?
These are big, difficult, and very interesting questions.
 Of course, we start with the usual suspects. We count things. How many new projects are initiated? How many people are involved? How many trans-disciplinary collaborations are formed? How many students and new investigators are mentored and trained? How many publications result from the research done? How much new grant funding is obtained to further the work? Remember, the pilot funds offered by CTSA hubs are seed funds. They are meant to help get projects started, not fund them forever.
But what else besides these common metrics can we look to to draw a bigger picture of the success of our work? This, you guessed it, is where we look at alternative or altmetrics.
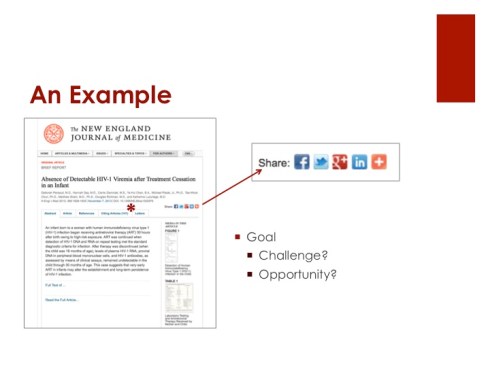 So let’s take an example. Here’s a paper authored by one of our researchers and funded, in part, through the resources and services of the UMCCTS. When we’re counting publications as a measure of success, it’s one that I can count. The other thing that I can count that’s fairly traditional is the number of citing articles. We know that this is a relatively good marker for impact – someone citing your work means that they used your work, in some way, to further their own. So the original work is having an effect. In this case, I could point out that 141 other publications needed to use this publication somehow. So we’ve got a reach, in the simplest terms, of 141 – 141 people, projects, research studies, something. This we can say from these two metrics: 1 paper, 141 citations.
But as we all know, today’s communication tools allow for much broader – and easier – dissemination of science. One of my goals, in my work, (you could see it as a challenge and/or an opportunity, too), is to help researchers and funders and other stakeholders appreciate the value of these other tools. To help them see how these tools give us a whole set of other metrics that can help us evaluate the impact of the work.
 This particular paper is always a good example because you can clearly see, via the Altmetric tool, how far it’s traveled beyond the strict confines of scholarly, scientific publications. It’s also reached news outlets and social media users. It’s reached a wide cross-section of people – the general public, patients, other health care practitioners, other researchers in different disciplines. These are also important. We can argue over the level of importance, as compared to citations, but it’s difficult to ignore them – to claim that they have nothing to say when it comes to the measurable impact of this one paper.
The other reason that I like to use this particular paper as an example, besides its impressive Altmetric donut, is because the final author listed – one of the co-PIs for this work – also happens to be the PI for our CTSA site. She’s my boss. The big boss. She’s one of the PIs involved in the evaluation initiatives for NCATs. The first time that I demoed the Donut for her, she loved it. How could she not? Apart from the non-biased reaction that it’s good to see one’s work being shared, it’s also a great ego boost. Researchers, in case you don’t know, are a little bit competitive by nature. They like to see a good score, a good result, a big donut… you name it. They like it.
For those of us trying to reach the goal of bringing altmetrics into favorable light within very traditional disciplines, being able to show this type of example to your stakeholder, in this instance, my boss … it works.
 So day to day, I spend a lot of time at my rock pile doing these sorts of things. I establish collections of publications, related to different groups within the UMCCTS. I maintain those collections regularly – using Collections within MyNCBI in Pubmed, or Scopus and SciVal – two tools available to me thanks to the Library of UMass Medical School. I collect data related to the common metrics outlined by NCATS, but I also collect the altmetrics. I track them all. And then I report on them all via progress reports and infographics (my latest love). It’s an ongoing – never ending – project, but it’s certainly interesting to step back from time to time and look at the big picture, the story, that all of these metrics, together, tell us.
I recently finished the final progress report for the first 5-year funding cycle of our CTSA. It really was impressive to see where we are today, in comparison to where we were just 8 or 9 years ago, when the idea of establishing a clinical and translational science center at UMass Med first took hold.
 “Telling the story” is what my PI reminds me is my job. Using common and alternative metrics, I can tell the story of this one clinical research scholar who, over the past several years, has published 18 papers related to work she’s done in this program. These papers have been cited, she’s worked with many colleagues as co-authors, she’s developed a number of effective collaborations, she’s presented her work locally, regionally, and nationally, and she’s received several new grants to help her continue in her area of research. She’s also reached the public, patients, and other health care providers through multiple means.
Based on all of these metrics, I can write a pretty good story of how well this one doctor is utilizing the resources of the UMCCTS to inform practice and improve care. In a nutshell, I can tell a story of the impact of her research. If I repeat the same for each of our clinical scholars, or a group of researchers utilizing one of our research cores, or one or more of our pilot-funded projects … the story, the picture, gets bigger and, hopefully, clearer. Our Center is making a difference. That’s what we want to show. And that’s possible through the use of all of these tools and metrics.
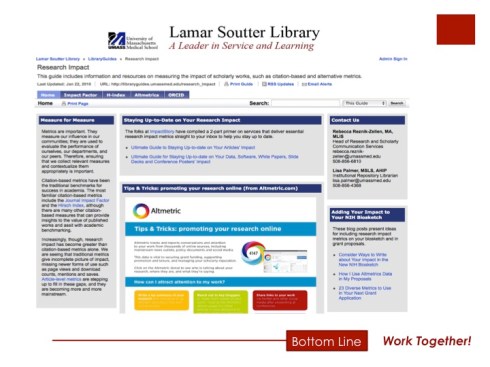 Finally, I want and need to give a shout-out to my former colleagues and friends over at the Lamar Soutter Library here at UMass Med. I worked in the Library for 10 years before moving to the UMCCTS a little over a year ago now. It’s the work that I did in the library that first enabled me to build a relationship with our Center, and then inspired me to approach them to do the evaluation work that I do for them now. Kudos to the LSL for all of the initiatives carried out related to scholarly communications and research impact. I think together we’re helping change the environment around here and raising the level of awareness and acceptance of altmetrics.