Last week, a colleague that I follow on Twitter retweeted a post from the blog, NatureJobs, titled , So you want to be a data scientist by Michael Koploy of SoftwareAdvice.com. The colleague who originally brought the piece to my attention, Kristi Holmes, PhD, is a bioinformaticist at Becker Medical Library at Washington University in St. Louis School of Medicine. She’s also an all-around good egg and one of my absolute favorite colleagues in the field, but that’s beside the point. I would have read the piece regardless of who tweeted it to my attention. However, because it came from Kristi, we then engaged in a mini tweetchat that we’ve had before, i.e. Where and what is the intersection between data scientists and librarians, if there even is one?
One of the interesting things about this discussion, to me, is that Kristi is a scientist who happens to work in a library, while I am a librarian, trying to work in the arena of scientists. And from our different perspectives, she is the one who is routinely much more optimistic about librarians getting into the area of data than I. There’s probably a thing or two you can decipher from this, but that’s for another time.
Another thing that happened after I retweeted and commented on the post was that I got an email from Brittany Richards at Software Advice thanking me for the tweet and additionally, asking if I’d do a blog post of their article here on the Librarian Hats blog. Specifically, Brittany wrote, “You mentioned library science and I was interested to see your thoughts on how the two are related to each other.”
Now if you’ve read this blog for any time, you know my answer was an enthusiastic, “SURE!” So here goes – a recap of that article and some summarizing of conversations I’ve had with Kristi and other scientists on the topic:
 I once saw/heard a librarian give a presentation where he identified himself as a data scientist. I called him on it. I am a librarian with a graduate degree in library & information science. I also have a graduate degree in an applied biological science (exercise physiology). Given that background, I feel pretty comfortable stating that while the two share the word, there is a world of difference between the science that librarians do and that which takes place in laboratories, clinics, the field, etc. As I’ve stated in this blog before, my background in exercise physiology is what I feel gives me the extra tools that I need to be effective as an informationist. That’s the science background that is recognized in the sciences.
I hope you don’t hear me dissing my library degree, education, or career. I’m not at all. They are just different and when I read articles like Koploy’s, as well as many books on data, specifically library and librarians’ roles in working with data, I cannot help but keep this thought in mind. It’s what comes to my mind. Every time.
In his post, Koploy recalls the description of a data scientist that he got from Bruno Aziza, a big name in Big Data. Aziza called a data scientist a “business analyst-plus.” He highlights mathematics, statistics, and business strategy as their core skills. Koploy himself adds, “While programming and statistical expertise is the foundation for any data scientist, a strong background in business and strategy can help jettison a younger scientist’s career to the next level.” Further, he notes that successful data scientists are drawn from the fields of biostatistics, econometrics, engineering, computer science, and the like. I’ve read the article several times. Library or information science is not on the list.
Again, this isn’t a slight against my field, but rather an observation that there are different skill sets required for different jobs and the job of a data scientist is not the job of a librarian. And vice versa.
So the question then becomes, how much does a librarian – or an informationist – need to learn to become a data scientist? I say, “A lot.” However, that “a lot” comes with the assumption that one isn’t entering data science from one of those previously mentioned fields. If this is the case, then of course, that individual is well prepared. You’ll note though, that even with the background, Koploy points out that data science is (1) fast-growing, (2) extremely competitive, and (3) new. Even the most seasoned statistician needs to learn some new skills and/or subjects to keep up.
The optimistic among us – those who believe the cross-over between information and data science is broad – focus upon those characteristics that are, in fact, mentioned by experts in the data science field as ones that separate the exceptional data scientist from the average; inquisitiveness, the ability to spot trends, and the tendency (skill) to ask the right questions. It’s the latter where librarians, informationists, and information scientists both have experience and often excel. We know how to ask the right questions that get to the heart of information problems, e.g. How does the business work? How does it collect data? How will it use the data? (per Krishna Gopinathan, Global Analytics Holdings)
So, do you want to be a data scientist? If you’re a librarian or an informationist, depending upon your background, you may or may not have a little or a lot of work to do to get ready to take on the role. If you don’t have the background, I see two possibilities:
- Get it (hit the books!)
- Find the right partner(s) where your skills can be paired to produce a good data science team
We choose careers for a lot of different reasons, but I like to believe that in the best case scenario, we choose something that we’re both interested in and good at. Remember those aptitude tests you took in the guidance counselor’s office in high school? They were (and still are) meant to measure something. They measure what we like and what we have an aptitude for. They measure what career would fit us best. It means something to be a librarian. It also means something to be a scientist. I believe that it’a a sign of the times, and a bit of a challenging time at that, that careers and skills and tasks that once sat neatly within cubicles and labs and computer workstations are now all mixed up together. This melting pot of vocations is difficult to navigate. On the one hand, it opens a wealth of new opportunities. On the other, though, it means for everyone working with information and/or data, we will never enjoy sitting back and doing the same old same old for very long.
If you’re interested, I also encourage you to read the original piece that Michael Koploy wrote, along with some of the links he suggests for further reading. In particular, I really enjoyed Hilary Mason’s blog. Good stuff there. I also happened to notice, just this morning, that Coursera’s free Introduction to Data Science class that’s listed is starting up in the not too distant future. If it piques your interest, give it a go. You might well find that you have a hidden talent that will take you far in this new area.
Which brings me full-circle to the question I began with, i.e. Is this new area in the library? Well, quite obviously there are individuals like Kristi, bioinformaticists and data scientists who find their home in libraries*. There are also librarians or informationists with training in data science who find their homes outside of the library. And then there are librarians. And then there are data scientists. In other words, there’s a big mix of us. If you’re comfortable in the mix and you’re up to the task of getting and/or honing new skills, you’ll likely do really well wherever you are.
The times they are a changin’, sings Mr. Dylan, and we look to change with them. At the same time, though, we need to be realistic. We need to see clearly what we know, what we do well, what we like, and more. We need changes in graduate education across the board to address these issues, and likewise those of us working need to accept that we’ll be learning for a lifetime. These are the times we live in. You can’t just call yourself something different. You need to do something different. Or do things differently. Likely all of the above.
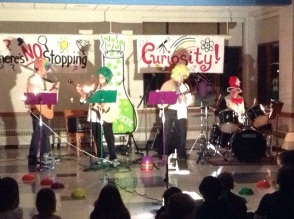
Rockin’ out with my pals, The Special Agents, at Houghton Elementary School. Support art, music, and physical education in your public schools, people! You could get a band out of it.
Now I’m off to play drums with a friend’s band, dressed up like the Cat in the Hat. You’ve got to have a really big tool box o’ skills, friends. Really big!
* And then there’s the matter of money. If you have the chops to get a job as a data scientist, are you willing to work for about half of what you could make in business or industry than you will in a library? It’s a question that comes up in our professional discussions often. If you want to have at it in the comments section to this post, go for it!