Old Dog, New Tricks

5 Oct

I write often in this spot about professional development, the importance of continuing to expand the skills we need to remain relevant in our work, and how curiosity plays the biggest role, in my opinion, in keeping one ever-growing and ever-learning. I thought about the topic more last night as I was driving home from an absolutely fantastic evening at the Brown University Arts Initiative. The show was a songwriting master class and performance led by Rosanne Cash and John Leventhal. (Any regular reader of this blog knows of my admiration and “awestruckness” of Rosanne, thus I won’t repeat it here.) This was the inaugural program in this new series that features accomplished musicians and songwriters to the campus to both perform and offer critique of students taking part in Brown’s Songwriting Master Class. Four incredibly talented young people played one song each, followed by thoughts and comments and suggestions from Cash and Leventhal. It was such a rich time, being able to hear individuals so proficient in something talk about their processes, offer tips that work for them, provide insights into how they chose this over that, etc. I’m grateful to Brown for starting this new program and look forward to attending future events. If you’re in the neighborhood, I encourage you to do the same.

My 45-minute drive home had me thinking about youth – and how I am far from that time in life now. I thought about those young people and some of the comments that they received from Rosanne and John. I thought about how they have a lifetime ahead of them to hone a craft, if they so choose. It started to become depressing, given that I just started writing songs about a year ago (not counting silly songs about science that borrow familiar tunes others penned). How can I ever become good at it?

But before I spent too long at my pity party, I began thinking this … 

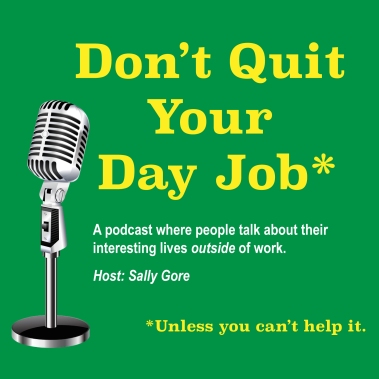
I decided to learn to play the drums when I was in my early 30s. I loved it. Still do. When we moved to an apartment that put a cramp on my pursuits in percussion, I picked up a mandolin, found some classes, found a teacher, and got to it. I was in my 40s then. I was knocking on the door of 50 when I performed for the first time ever at an open mic. I was 50 when I joined some friends in a band. And just last year, at the ripe young age of 53, I went to my first songwriting camp and began to write my first “for real” songs. At 54, I started hosting a radio show on my local community radio station and I’m about to launch a new podcast. At 55 … well, I’m not quite there yet, so we’ll just wait and see what comes next. 

Podcast-Art-1

Reviewing this timeline in my head, I realized a few things. One, I’m a late bloomer when it comes to music. While I have always – ALWAYS – been a fan and collector and a reader of the art, I came to be a participant later in life. True, I took piano lessons for years as a kid, but it was really to justify my mom buying a piano for the house. She loved to play and had done so her whole life. Me, I was the tomboy who was happier playing ball with my older brother and his friends. But I did walk down the street to Mr. Cornett’s house each week, faithfully, for a number of years. Until I was paroled. Looking back, I needed to find music. It wasn’t going to find me.

Second, it is my nature to meander. I have now been in the same profession working at the same place longer, by far, than anything I ever did or any place I ever worked previously. It is one of my favorite professional development activities to lead, having people write down all of the jobs that they’ve ever had in life and all of the things that they subsequently know how to do because of those experiences. My lists are long. I’ve done many things, I have many interests, and I have the student loans to back it up. And I’ve come to appreciate this characteristic of myself over time. I like that I like a lot of things. I enjoy dabbling in all sorts of stuff. I used to believe that the drawback to this quality is that I’d never become very good at anything – “Jack of all trades, master of none” kind of thinking. There’s some truth to it, but it’s a choice we have to make in life. Some people choose to live all over the world while others, like my grandmother, live 94 years within the same city limits. Neither is better than the other. They are both valuable.

Which brings me to the third thing that I’ve been thinking about a lot lately as it pertains lifetime learning, professional growth, and the continuing work we do to find our place – whether professionally or personally. We can think of life in the singular or the plural. We can believe that we live one life or we can relish in living many. It’s a state of mind, I believe. I’ve surely lived more of my years already that I’ve left to live, but I’m drawn more lately to wondering about what to do with the different lives that I’ve yet to live and I like to believe that I’ve got maybe one or two left. 

What will I do with them? Maybe I’ll develop and lead more professional workshops around these things, encouraging other librarians to tap into and nurture their creative sides in their work. Maybe I’ll seek out something in the music industry that takes advantage of my skill set. Maybe radio. Maybe I’ll continue doodling data visualizations and writing reports about the cool things that happen via the UMCCTS. Who knows?

There are obstacles to thinking and living this way. We do live in a society that focuses much more on nurturing young people, those with years ahead to give to something, rather than older adults who may cost more and not give the ROI an entity seeks. It’s hard to find fellowships or internships or opportunities that allow one to learn a new profession later in life, but that said, it’s not impossible. (ProFellow is one helpful resource here.)

For me, I believe the most important thing is to remember that we don’t need to be young to either learn – or become good at – something new. It’s all in the mindset we choose to adopt. Let’s all keep growing together!

I think I’ll write a song during lunch. 

SaveSave

Data Viz Sing-Along!

13 Sep

I was invited to give an 8-minute lightning talk at this evening’s SLA New England event in Boston called, Organizing Our Digital World. My topic is data visualization. Easy, right? Normally, yes, but in this case I have to give a talk on data visualization without the use of any visuals! I love a good challenge and this was just that. I mulled for weeks over how I might pull this off until it finally came to me, Schoolhouse Rock! Remember those? I loved them as a kid. I still know many by heart. And so I thought, if I can still remember conjunctions thanks to Conjunction Junction, maybe folks will be able to remember a few things about choosing the right chart for presenting data if I put the rules into a song.

Well, per my usual, my song became lengthy and wordy and without a good hook like, “Conjunction Junction, what’s your function…” but I still think it will work for tonight. Now I just need 2 minutes of fill to get to the 8-minute mark!

A huge credit for the basis of this song goes to Stephanie Evergreen. Her book, Effective Data Visualization, is a constant companion in my work and what I know of choosing the right charts, I learned from her books, tutorials, blog posts, and more. If you need some expert advice in this area, do seek her out.

So here’s the song (truly, a one-shot practice filmed in my studio last night). You’ll find the lyrics below. Feel free to sing along!

Data Viz: A Lesson in Verse
Sally Gore

I was spending time looking at some data
Figuring out the story it could tell.
Taking time studying the data
Lots of rows and columns in Excel.
I needed to get a report to my boss,
I needed to get it to her quick.
And though I wasn’t shooting for form over function
I still wanted to make it something slick.

I took a moment, pulled some books from my shelf.
Seeking out some expert advice.
Two books by Stephanie Evergreen,
I think they’re worth much more than their price.
I flipped to the page that talks about the science,
The work of Cleveland and McGill
Turns out that humans aren’t innate at reading data
And choosing the right charts takes some skill.

One of the books has a “Chart Chooser Cheat Sheet”
That I find an awful handy tool.
Plus a deck of “Chart Chooser” cards
Together they help me learn the rules.
So when I was invited to give this talk
Without the use of any picture cues
I thought I’d try and turn the rules into song
To quickly teach them all to you.

So here we go …

When you’ve got a single number
That you’re trying to convey
A single number of great importance,
The simple, single thing the numbers say.
The easiest means to get that thought across,
Is forget about charts of any kind,
Just write that number big and loud on the page
There’s no need to clutter people’s minds.

Other times you need to describe,
How two numbers are alike or not.
Bars side-by-side or back-to-back,
Try these or else a dot plot.
If you’ve got one group in particular
That changes while the others stay the same
Consider how a slopegraph can easily show
The difference that you’re trying to claim.

Many times you’ll find you’ve got a benchmark
And the story’s all about meeting goals.
Often times we measure performance
It’s important when we’re talking bankrolls.
A benchmark line across a line of columns
Will easily get the point across.
So will a bullet chart or indicator dots,
Pick and choose from these for the boss.

Now you know we LOVE to give surveys,
So what the survey says, we’ll need to show.
For this task there are lots of choices
Involving bars stacked up in a row.
Stacked or diverging, aggregated, too,
Or a bunch of small multiples across the top.
And if you get tired of plain old bars,
Show the same thing with a lollipop.

What about when there are parts of a whole,
Like a bunch of demographics of a group?
It’s easy to default to that famous old pie chart
But listen up folks, here’s the scoop.
Pie charts are old, pie charts are boring
But most they’re often difficult to read
Try a histogram, a tree map, a stacked bar instead
Or perhaps no visual is what you need.

Sometimes you’ve got some data that shows
How things changed over time.
It’s really pretty common, we see it quite a lot,
Did our numbers shrink or did they climb?
Well a few chart types that I sung about already
In this case will also do the trick
Think line graph, a slope graph, a dot plot, too,
Or a deviation bar’s a perfect pick.

Now you might be asking, “How about a scatterplot?”
I learned of those in Stats 101.”
And I must admit finding patterns in a scatter
Really can be a lot of fun.
A bunch of points plotted ‘cross an “X” and a “Y”
Show relationships between “A” and “B” –
When “A” does this, “B” does that,
And is there any trend that you can see?

Sometimes your data isn’t numbers at all,
But rather lots of words said or wrote.
Qualitative methods produce the kind of data,
Where the words give the meaning to take note.
Callouts are useful, heat maps can help,
Or you can make a cloud filled with words.
Each of these is handy, each of these works,
And your meaning won’t get lost on numbers nerds.

So that’s a few tips, I hope you find helpful
When you think about the story you can tell
As you’re sitting there staring at a spreadsheet of data
And all you really want to do is yell.
Start at step one, learn the different charts
And when and how and where they work best.
Once you’ve conquered that you just need to learn to make them
Step-by-step, you’ll have passed the test.

And no one will sit there staring at your PowerPoint slide or your report or your article wondering, “What the heck does this mean?!

Rabbit Rabbit!

1 Sep

Wild_Rabbits_at_Edinburgh_ZooHappy September, everyone! Cooler temperatures and warmer colors are on their way. Fall is my favorite season of the year and the arrival of the “-ber” months makes me happy. I know many are sad to see summer ending, but it’ll be back again soon enough.

I’ve stumbled across a few cool sites and tools and such to share. No better day than the first of the month to do so. I hope you find some of them as interesting and/or helpful as I have.

First off, The Pudding: A Weekly Journal of Visual EssaysWhat an amazing find! This is a fascinating (and growing) collection of articles about topics ranging from culture to politics to sports to music, each enhanced by some terrific graphs and tables. It’s a great way to see how data visualization can be used to make essays more readable, understandable, and fun. Check it out!

If you want to get cracking on your own data visualizations to accompany your writing, you can find all the inspiration and quick start you need at Stephanie Evergreen’s new collection of step-by-step guides to a whole host of charts. You will bookmark it and visit often. Guaranteed.

ChartsBin is a useful site for finding and creating data visualizations. If making dynamic/interactive visuals for the web isn’t your forte (it’s not mine), a site like ChartsBin can come in very handy.

Helping professionals write and speak without using the jargon of their field is a challenge. For scientists, the new De-Jargonizer tool can help. It’s a quick way to check how well a written piece translates to different levels of the general public. I’ve popped a few abstracts from articles into it and the results have been pretty good. It’s helpful to see which words/phrases might be edited for a lay audience. 

Lastly for today, my next big learning adventure in life is to launch a podcast. I’ve been wanting to do this for some time, but I struggled to come up with the right bent for it. I finally did and am now in the process of learning all about the ins and outs of creating podcasts. If you’re interested, I hope you’ll stay tuned for updates and tune in, once I take off. I can’t wait!

Podcast-Art-1

For those celebrating the long weekend ahead, Happy Labor Day!